A nightmare Snowflake scenario that we’re all too familiar with? Dealing with large bursts of queries, without paying for oversized warehouses you hardly use.
If you’ve ever watched your queries stack up in a queue because you hit the warehouse concurrency limit, you know it’s more than a minor inconvenience.
Instead of simply making our warehouse bigger or relying on multi-cluster scaling alone, Ideveloped a more effective approach that’s helped clients save up to 30% on monthly Snowflake bills.
In this article, I’ll explain:
- What concurrency is
- Why bigger warehouses aren’t always better
- What the real problem is here (spoiler: it’s concurrency limits)
- How to conquer your unpredictable queries (with real world examples!)
- How you can plan your Snowflake setup to handle spikes in query traffic
- Tips for tuning Snowflake concurrency
I’ll also include code snippets so you can try out some of these ideas yourself.
Why Bigger Warehouses Alone Aren’t Enough
Snowflake sets a maximum number of queries that can run simultaneously on any single warehouse. This means that once you hit that limit, new queries go into a queue and wait until one of the active queries finishes.
If you want to avoid long wait times, you might think, “Let’s just switch to a larger warehouse or enable multi-cluster mode.”
That can help for a while, but it may also raise your bill if you’re only using that extra power during short, intense bursts.
Here’s exactly why bigger warehouses can mean bigger bills in the long run:
- Short Spikes Can Be Costly
This is what I was talking about above. If your traffic is unpredictable, you get stuck withspinning up large warehouses or multiple clusters only to use them for a rare 20 minute period. Snowflake’s auto-suspend feature does help, but that time spent until shut down bill waits for no one.
- Multi-Cluster Scaling Takes Time to Kick In
Even though Snowflake automatically adds clusters when concurrency spikes, it can take around 20 seconds for a new cluster to be fully ready to handle queries. Those 20 seconds matter if you have urgent dashboards or real-time analytics that need immediate responses.
- One Size Doesn’t Fit All
Some queries are quick (like small selects), others are huge (like complex aggregative queries), and they shouldn’t always share the same resources in a one-size-fits-all approach.
I’ve seen a lot of Snowflake setups struggle with unpredictability. That’s why at Yuki, we set out to create a more balanced method that can handle up and down workloads while keeping costs in check.
The Core Issue: Concurrency Limits
Snowflake’s concurrency model is simple on paper: each warehouse has a specific number of “slots” for running queries. When all slots are taken, new queries have to wait. That wait time is what frustrates end users – especially if you’re dealing with business dashboards or applications that need fast results.
To see how your queries are performing under concurrency, you can look at Snowflake’s built-in “Account Usage” views. One helpful table is SNOWFLAKE.ACCOUNT_USAGE.QUERY_HISTORY, which logs information about each query.
For example, you can run:
-- This query checks how many queries are running in parallel per second,
-- so you can see when concurrency might be peaking.
CREATE OR REPLACE TEMPORARY TABLE last_7_days_concurrency_per_second_per_warehouse AS
WITH source AS
(
--
SELECT query_id,
warehouse_id,
warehouse_name,
warehouse_size,
start_time,
end_time,
execution_time
FROM snowflake.account_usage.query_history
WHERE warehouse_size IS NOT NULL
AND warehouse_name NOT LIKE '%COMPUTE_SERVICE%'
AND start_time >= CURRENT_DATE - 7
--
)
, warehouses_list AS (
--
SELECT warehouse_id
, warehouse_name AS cluster_name
, warehouse_size
FROM source
GROUP BY ALL
--
)
, filtered_queries AS (
--
SELECT query_id
, warehouse_size
, warehouse_id
, TIMEADD(MILLISECOND, -1 * execution_time, end_time) AS execution_start_time
, start_time
, end_time
FROM source AS q
--
)
, seconds_list AS (
--
SELECT DATEADD('second', tbl.id, CURRENT_DATE - 7) AS second_start,
DATEADD('second', tbl.id + 1, CURRENT_DATE - 7) AS second_end
FROM (SELECT ROW_NUMBER() OVER (ORDER BY NULL) AS id
FROM TABLE (GENERATOR(ROWCOUNT => 24 * 7 * 3600))) AS tbl
--
)
, warehouse_seconds_active_aggregations AS (
--
SELECT wh.warehouse_id
, wh.cluster_name
, wh.warehouse_size
, sl.second_start
, SUM(CASE
WHEN sl.second_start = DATE_TRUNC(SECOND, queries.execution_start_time)
THEN 1 - (DATEDIFF(MILLISECOND,
DATE_TRUNC(SECOND, queries.execution_start_time),
queries.execution_start_time) /
1000)
WHEN sl.second_start = DATE_TRUNC(SECOND, queries.end_time)
THEN (-1) *
(DATEDIFF(MILLISECOND, queries.end_time,
DATE_TRUNC(SECOND, queries.end_time)) /
1000)
WHEN queries.query_id IS NULL THEN 0
ELSE 1 END)::NUMBER(18, 3) AS queries_per_second
FROM warehouses_list AS wh
INNER JOIN seconds_list AS sl
ON 1 = 1
INNER JOIN filtered_queries AS queries
ON wh.warehouse_id = queries.warehouse_id
AND sl.second_start BETWEEN
DATE_TRUNC(SECOND, queries.execution_start_time) AND queries.end_time
AND wh.warehouse_size = queries.warehouse_size
GROUP BY ALL
--
)
, warehouse_per_second AS (
--
SELECT wh.warehouse_id
, wh.cluster_name
, wh.warehouse_size
, sl.second_start AS second_start
, sl.second_end AS second_end
, ZEROIFNULL(qa.queries_per_second) AS queries_per_second
FROM warehouses_list AS wh
INNER JOIN seconds_list AS sl
ON 1 = 1
LEFT JOIN warehouse_seconds_active_aggregations AS qa
ON wh.warehouse_id = qa.warehouse_id
AND wh.warehouse_size = qa.warehouse_size
AND sl.second_start = qa.second_start
--
)
SELECT *
FROM warehouse_per_second;
SELECT second_start,
queries_per_second
FROM last_7_days_concurrency_per_second_per_warehouse
WHERE 1 = 1
AND second_start >= '<x-x-x 06:00:00>'
AND second_start < '<x-x-x 07:00:00>'
AND cluster_name = '<YOUR_WAREHOUSE>'
AND queries_per_second > 0
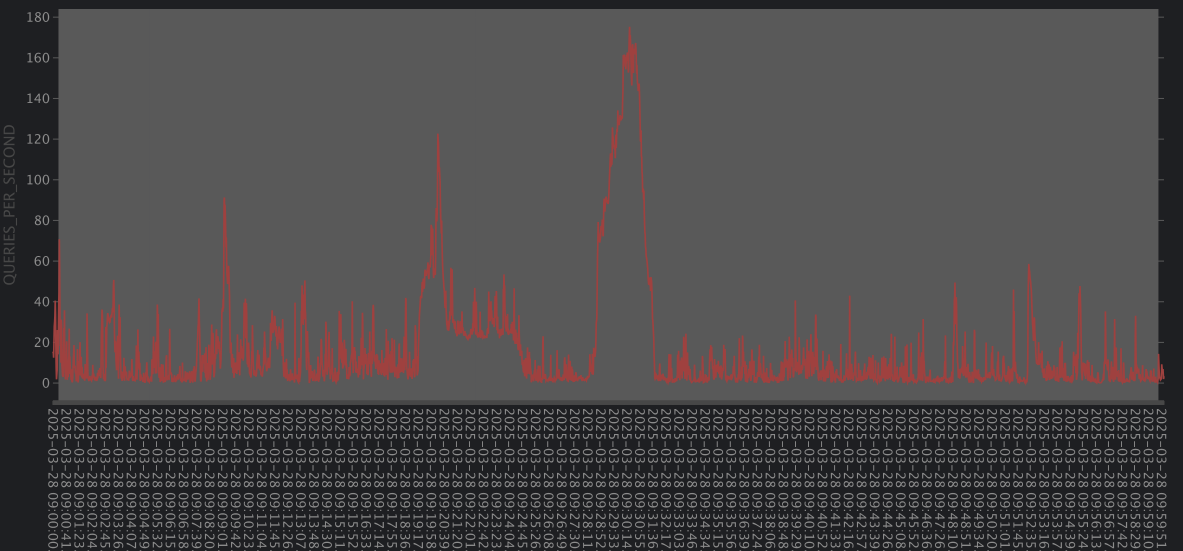
ORDER BY 1Use this to identify when concurrency spikes happen and how large they are.
Analyze this data on an hourly basis for general trends.
Avoid aggregating the data when looking for concurrency spikes though – examine it at the per-second level instead. Aggregation can obscure short bursts of high concurrency that are critical to identify.
How We “Bent” the Query Governor
Snowflake still enforces concurrency limits on every warehouse, but our platform at Yuki adds a layer of logic that decides where queries should run and when. Think of it like a traffic light system: instead of letting all cars rush into the same intersection, we direct them so no single intersection gets jammed.
Here’s how it works:
Use Staggered Scheduling
We distribute bursts of queries across multiple warehouses, taking advantage of our own routing rules. The key difference is that we track in real-time which clusters are busy and which are free. There’s none of Snowflake spin ups an extra cluster when load spikes and stealing 20 seconds of your time (and money). Our tool, Yuki, sees that concurrency is rising and directs new queries to warehouses already running, minimizing wait times.
We also can look at query tags (like dbt models description – using our open source package) to decide if a query needs immediate attention or if it can handle a brief wait.
{% macro set_query_tag() %}

    {% set model_name = this.name %}

-- Retrieve from environment variable, or use 'default_job'

    {% set job_name = env_var('DBT_JOB_NAME', 'default_job') %}

-- Create JSON formatted query tag

    {% set query_tag = '{"dbt_job":"' ~ job_name ~ '", "dbt_model":"' ~ model_name ~ '"}' %}

-- Set the query tag in Snowflake

    ALTER SESSION SET QUERY_TAG = '{{ query_tag }}';

{% endmacro %}- Check out our dbt open source package for more details.
Create Priority Rules
Snowflake allows session-level parameters that affect how queries queue or time out:
-- This session parameter sets how long a query can wait in a queue

-- before it's considered "timed out." Yuki can adjust this dynamically

-- depending on your workloads.

ALTER SESSION SET STATEMENT_QUEUED_TIMEOUT_IN_SECONDS = 5;
If a query is stuck in one warehouse’s queue for too long, Yuki can move it to a less-burdened cluster.
We also use QUERY_TAGs to classify queries. For example, you might do:
ALTER SESSION SET QUERY_TAG = 'urgent_reporting';In your application logs or in Snowflake’s QUERY_HISTORY, you can see which queries are truly “urgent.” Prioritize those over batch processes that can wait.
Complete Real-Time Awareness
Yuki continuously checks each warehouse’s concurrency level, queue length, and recent query performance. This helps you:
- Proactively route new queries to avoid building large queues.
- Monitor spin-up times of new warehouses.
Because Yuki manages the traffic, we’re able to monitor warehouse statistics without directly querying the Snowflake warehouses, such as:
SHOW WAREHOUSES;Managing Snowflake Query Unpredictability: A Real-World Example
One of our clients offers a reporting tool for their customers, and they experienced a big spike in queries at any hour during the day.
- Before Yuki: They thought about simply doubling the size of their Snowflake warehouse or relying heavily on multi-cluster scaling. Both approaches are valid, but they were worried about the potential cost and large queues that will affect the SLA.
- After Yuki: The moment concurrency started rising, we allowed immediate queries to jump to less-busy warehouses with minimum queue times. As a result, queue times dropped from over a minute to under 5 seconds, and monthly Snowflake bills went down roughly 30%.
What This Means for the Query Governor
We’re not breaking or bypassing Snowflake’s concurrency rules, we’re working within them.
But how?
Snowflake still imposes a limit on each warehouse, but by adding a “traffic control” layer, we can avoid pushing one warehouse to its limit while others remain underused.
When we say we “bent” the Query Governor, we mean we’ve simply built a smarter dispatcher. It doesn’t violate any Snowflake best practices – quite the opposite. We still respect the concurrency limit on each warehouse. We’re just helping you save money at the same time.
How to Check Your Current Snowflake Workload and Warehouse Status
The following query helps you identify periods of contention when multiple queries were queued simultaneously. Look for significant spikes, then investigate further to understand how long those queries remained in the queue during those times.
CREATE OR REPLACE TEMPORARY TABLE last_7_days_queue_per_second_per_warehouse AS

WITH source AS

    (

        --

        SELECT query_id,

               warehouse_id,

               warehouse_name,

               warehouse_size,

               start_time,

               end_time,

               execution_time,

               queued_overload_time

        FROM snowflake.account_usage.query_history

        WHERE warehouse_size IS NOT NULL

          AND warehouse_name NOT LIKE '%COMPUTE_SERVICE%'

          AND start_time >= CURRENT_DATE - 7

        --

    )

   , warehouses_list AS (

    --

    SELECT warehouse_id

         , warehouse_name AS cluster_name

         , warehouse_size

    FROM source

    GROUP BY ALL

    --

)

   , filtered_queries AS (

    --

    SELECT query_id

         , warehouse_size

         , warehouse_id

         , TIMEADD(MILLISECOND, -1 * (execution_time + queued_overload_time), end_time) AS queue_start_time

         , TIMEADD(MILLISECOND, queued_overload_time, queue_start_time)                 AS queue_end_time

         , start_time

         , end_time

    FROM source AS q

    WHERE queued_overload_time >= 500

    --

)

   , seconds_list AS (

    --

    SELECT DATEADD('second', tbl.id, CURRENT_DATE - 7)     AS second_start,

           DATEADD('second', tbl.id + 1, CURRENT_DATE - 7) AS second_end

    FROM (SELECT ROW_NUMBER() OVER (ORDER BY NULL) AS id

          FROM TABLE (GENERATOR(ROWCOUNT => 24 * 7 * 3600))) AS tbl

    --

)

   , warehouse_seconds_queues_aggregations AS (

    --

    SELECT wh.warehouse_id

         , wh.cluster_name

         , wh.warehouse_size

         , sl.second_start

         , COUNT(*) AS queries_per_second

    FROM warehouses_list AS wh

         INNER JOIN seconds_list AS sl

            ON 1 = 1

         INNER JOIN filtered_queries AS queries

            ON wh.warehouse_id = queries.warehouse_id

        AND sl.second_start BETWEEN

                   DATE_TRUNC(SECOND, queries.queue_start_time) AND queries.queue_end_time

        AND wh.warehouse_size = queries.warehouse_size

    GROUP BY ALL

    --

)

   , warehouse_per_second AS (

    --

    SELECT wh.warehouse_id

         , wh.cluster_name

         , wh.warehouse_size

         , sl.second_start                   AS second_start

         , sl.second_end                     AS second_end

         , ZEROIFNULL(qa.queries_per_second) AS queries_per_second

    FROM warehouses_list AS wh

         INNER JOIN seconds_list AS sl

            ON 1 = 1

         LEFT JOIN warehouse_seconds_queues_aggregations AS qa

            ON wh.warehouse_id = qa.warehouse_id

        AND wh.warehouse_size = qa.warehouse_size

        AND sl.second_start = qa.second_start

    --

)

SELECT *

FROM warehouse_per_second;

SELECT second_start,

       queries_per_second

FROM last_7_days_queue_per_second_per_warehouse

WHERE 1 = 1

  AND second_start >= '<x-x-x 06:00:00>'

  AND second_start < '<x-x-x 07:00:00>'

  AND cluster_name = 'YOUR_WAREHOUSE'

  AND queries_per_second > 0

ORDER BY 1
For broader patterns, we recommend analyzing the data on an hourly basis.
However, when you’re specifically trying to detect spikes in queuing, it’s crucial to analyze the data at a per-second granularity. Aggregating over longer intervals may mask short-lived but impactful queue buildups, which are essential to uncover for accurate performance tuning.
If you notice consistent spikes at certain times, plan around them by:
- Pre-spinning a larger warehouse or multiple clusters just before the spike (if it’s predictable).
- Tagging your heaviest queries so you can see if they’re causing concurrency bottlenecks.
Final Tips for Tuning Concurrency in Snowflake
- Tag Your Queries
Use descriptive QUERY_TAGs (e.g., “finance_reporting” or “bulk_etl”) so you can easily see which type of queries cause concurrency spikes. This makes your query logs more readable and helps you decide how to route them.
- Monitor Key Metrics
Keep an eye on concurrency, queue lengths, and cluster numbers. You can do this by regularly querying SNOWFLAKE.ACCOUNT_USAGE views. Know how long it takes for a new cluster to become available and factor that into your approach.
- Fine-Tune Session Parameters
STATEMENT_QUEUED_TIMEOUT_IN_SECONDS is crucial. If you set it too low, queries might fail to run if they can’t find a free slot. Too high, and they sit in a queue for too long. Experiment with different timeouts to strike a good balance between performance and cost.
- Plan for Short Spikes
If your concurrency jumps at certain times every day (like end-of-day reporting), schedule a slight ramp-up for that period. Don’t rely only on multi-cluster scaling to magically save you. Proactive planning can prevent many issues.
- Revisit Strategy Often
Your concurrency patterns might shift from quarter to quarter as your user base or data volumes change. Check your concurrency data and warehouse usage at least monthly.
- Invest in a Third-Party Tool
Look into getting a third-party tool like Yuki. Constantly monitoring and optimizing Snowflake performance is a whole job in and of itself, but it doesn’t have to be, especially if you look into investing in a plug-and-play opportunity like Yuki.
Yuki uses predictive modeling. That means we learn from your past experience and use historical usage data to predict future spikes. That means we can always warm up extra clusters or shift queries at just the right time, cutting down on spin-up delays and saving you money.
Our ultimate goal is to harness Snowflake’s power without forcing people to either overpay for massive warehouses or accept long query queues. By combining real-time routing, priority rules, and a good understanding of Snowflake’s concurrency behavior, you get the best of both worlds: high performance and reasonable costs.
So, if you’re experiencing big concurrency spikes, or you’re tired of paying for a warehouse that underutilized most of the day, consider a more proactive approach like Yuki.
I hope this article helps you think differently about concurrency in Snowflake. If you have questions or want to share your own experiences, feel free to reach out. We love swapping stories about pushing Snowflake to its limits in smart, efficient ways.
Thanks for reading,
Amir Peres, CTO of Yuki