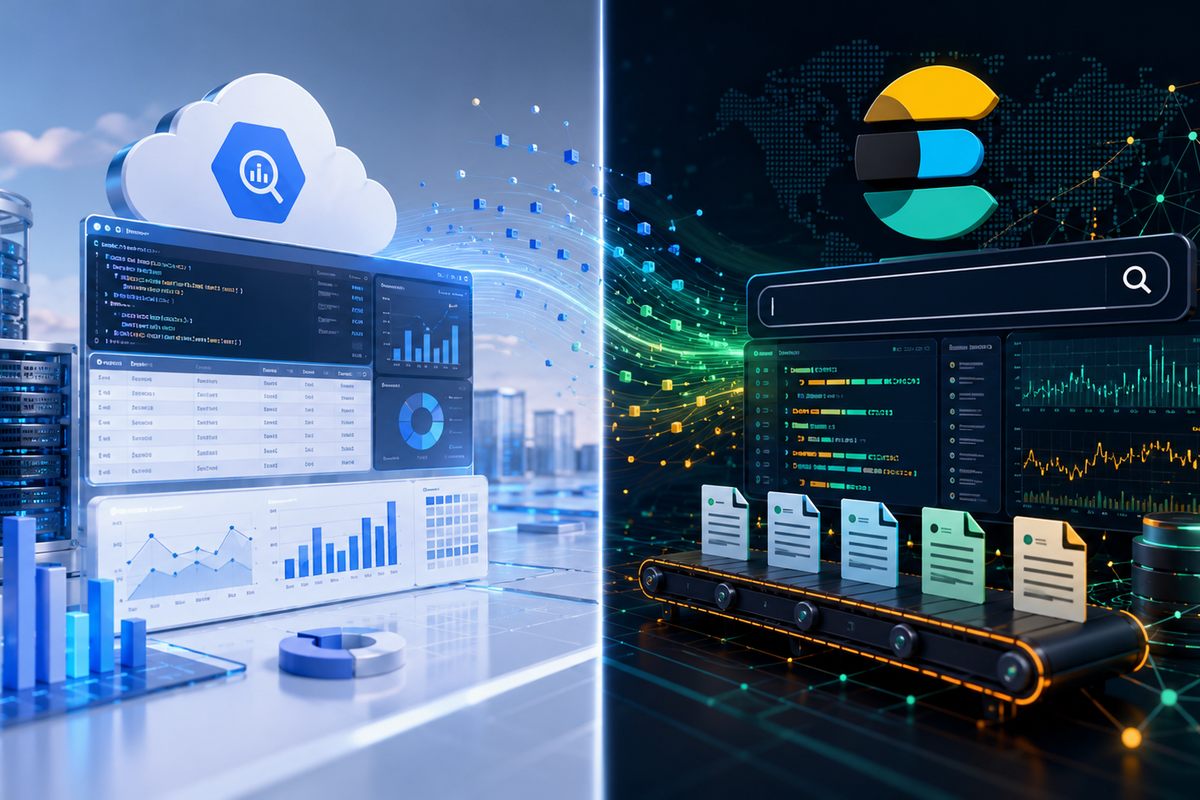
If you’re reading this, you’re probably not choosing a database in the abstract. You’ve got logs, events, or application data piling up; a search bar or dashboard that needs to hit it fast; and a growing suspicion that the tool you picked two years ago isn’t the right fit anymore.
BigQuery and Elasticsearch get compared constantly because they both handle huge volumes of data well, but they were built to answer completely different questions.
One is a data warehouse optimized for scanning billions of rows with SQL.
Another is a search engine optimized for finding the right needle in a haystack of documents in milliseconds.
Picking the wrong one doesn’t cause immediate problems. It shows up three months later as a six-figure BigQuery bill from a team that was really running a search workload, or an Elasticsearch cluster that’s been re-indexed four times because someone tried to force it into analytics duty it was never designed for.
Read on to get an honest breakdown of where each one wins, where each one struggles, and the best answer for which tool is the best for each situation.
What Is BigQuery?
BigQuery is Google Cloud’s fully managed, serverless data warehouse. It stores data in a column format, which means it’s built to scan massive amounts of structured data quickly when you’re aggregating, filtering, or joining across large tables.
There’s no cluster to provision and no nodes to size. Your team just has to write SQL, and BigQuery figures out how to distribute the query across its infrastructure. You then get the results back, typically in seconds, even against tables with billions of rows.
Compute is billed either:
- On-demand: Per terabyte of data scanned
- Capacity-based Editions: You pay for dedicated slot capacity per hour
Storage is billed separately, and billing drops automatically after 90 days of inactivity. BigQuery pricing can be confusing, especially to teams new to BigQuery, so carefully review how your spend works to keep your invoices from taking you by surprise.
What Is Elasticsearch?
Elasticsearch is a distributed search and analytics engine built on Apache Lucene. It stores data as JSON documents and builds an inverted index over that data as it’s written, which is what makes full-text search and near-real-time queries so fast. Instead of scanning columns to answer a question, Elasticsearch looks up matches directly in its index.
It runs as a cluster of nodes that you either self-manage or host with Elastic Cloud, and it acts as the backbone of the broader Elastic Stack (Elasticsearch, Kibana, Logstash, Beats). It’s commonly used for:
- Log analytics
- Application performance monitoring
- Security event correlation
Where BigQuery answers “how much revenue did we generate last quarter by region,” Elasticsearch answers “find every request from this IP in the last 10 minutes that returned a 500 error.”
BigQuery vs. Elasticsearch: What’s the Real Difference?
The core distinction between BigQuery and Elasticsearch isn’t performance or scale. Both handle massive datasets well. The difference lies in what each system was designed for:
- BigQuery is built for analytical throughput and reading enormous amounts of structured data efficiently to answer aggregate questions
- Elasticsearch is made for retrieval speed and finding specific documents or events out of a huge pool almost instantly, often within milliseconds of ingestion
The difference between the two affects everything else:
- How you model data
- How you query it
- What it costs
- How much operation work it takes to keep running
| Google BigQuery | Elasticsearch | |
| Core model | Serverless columnar data warehouse | Distributed search and analytics engine |
| Data structure | Structured tables, defined schema | JSON documents, flexible/schema-on-write |
| Query language | Standard SQL | Query DLS (JSON), also supports SQL via Elasticsearch SQL |
| Ingestion-to-query latency | Seconds to minutes for batch loads | Near real-time, typically under a second |
| Query latency at scale | Seconds for large aggregations | Milliseconds for indexed lookups |
| Infrastructure management | None, fully serverless | Cluster sizing, shard management, node scaling |
| Pricing model | Pay per byte scanned or per slot-hour | Pay per node/instance (self-hosted or Elastic Cloud) |
| Best suited for | BI, reporting, large-scale batch analytics, ML feature pipelines | Log analytics, full-text search, security monitoring, real-time dashboards |
Query Performance: Large-Scale Aggregation vs. Sub-Second Lookups
BigQuery is exceptional at scanning huge tables and performing large-scale aggregations, exactly the kind of query a BI dashboard or monthly revenue report runs. It’s less suited to workloads where you need consistent sub-second response times on high-frequency lookups, because every query re-scans the relevant columns rather than hitting a pre-built index.
Elasticsearch flips that. Its inverted index means lookups and full-text matches return in milliseconds, even under heavy concurrent load. That’s why it’s the ideal choice for search-driven applications and live operational dashboards. But ask it to run a complex multi-table join or heavy aggregation across a year of history, and it starts to strain in ways a columnar warehouse won’t.
Here’s the same basic question, “how many error events occurred per service in the last 24 hours,” expressed in both ways:
BigQuery (SQL):
SELECT
  service_name,
  COUNT(*) AS error_count
FROM `project.logs.application_events`
WHERE severity = 'ERROR'
  AND event_timestamp >= TIMESTAMP_SUB(CURRENT_TIMESTAMP(), INTERVAL 24 HOUR)
GROUP BY service_name
ORDER BY error_count DESC
Elasticsearch (Query DLS):
{
  "query": {
    "bool": {
      "filter": [
        { "term": { "severity": "ERROR" } },
        { "range": { "event_timestamp": { "gte": "now-24h" } } }
      ]
    }
  },
  "aggs": {
    "by_service": {
      "terms": { "field": "service_name", "size": 20 }
    }
  }
}
Both queries get the same answer:
- BigQuery will happily run that same query against three years of history without you doing anything different
- Elasticsearch will run it fastest against the indices it’s actively serving – and you will need a retention and rollover strategy to keep that performance consistent as data ages
Cost Structure: Pay-Per-Scan vs. Pay-Per-Node
Cost structure is where the two platforms really diverge. It’s usually the deciding factor once teams get past the technical fit question.
BigQuery’s on-demand pricing charges $6.25 per TiB of data scanned, plus storage at $0.02 per GB for active data and $0.01 per GB for data untouched for more than 90 days.
Cost is directly tied to how much data your queries touch, not how much infrastructure you provision, so a well-partitioned, well-clustered table can keep costs low even at a large scale. On the other hand, that also means a poorly filtered query against an unpartitioned table can rack up real spend fast since BigQuery bills for scanned bytes even if your result set is tiny. Teams running consistent, high-volume query loads often move to capacity-based editions instead, where cost is tied to reserved slot hours instead of per-query scans.
Elasticsearch’s cost structure is fundamentally different because you’re paying for the infrastructure itself, whether that’s self-managed nodes or an Elastic Cloud subscription, not per query.
That can make costs more predictable because you know your monthly infrastructure bill. However, over-provisioned clusters can quietly waste money on idle capacity, while under-provisioned clusters can suffer from performance bottlenecks and require costly scaling. Shard count, replica settings, and hot/warm node tiering all affect the bill, and getting that tuning wrong is a common source of Elasticsearch cost creep.
Real-Time Ingestion and Freshness
If your use case depends on:
- Querying data seconds after it’s created
- Live security monitoring
- Fraud detection
- Operational dashboards
Elasticsearch’s near-real-time indexing is a meaningful advantage because data becomes searchable almost instantly after ingestion.
BigQuery can also support streaming inserts and make data queryable within seconds too, but it’s fundamentally optimized around batch and micro-batch analytical patterns instead of event-by-event operational lookups. It’s less about raw ingestion speed and more about what you’re doing with the data once it lands. BigQuery shines when you’re aggregating patterns across time, not when you’re monitoring individual events as they happen.
Scaling and Operational Overhead
This is the difference busy engineering teams feel most directly.
BigQuery is serverless:
- There are no clusters to size
- No shard rebalancing
- No node failures to manage
Your team can write queries, and Google handles the infrastructure underneath.
Elasticsearch scales horizontally, but that scaling isn’t automatic in ways BigQuery is. Someone else owns:
- Shard sizing
- Index lifecycle policies
- Node capacity
- Cluster health
That operational overhead compounds as data volume grows. Managed Elastic Cloud offloads some of this, but not all of it, and it comes at a premium over self-hosting.
For teams already stretched thin, this operational gap is often the real deciding factor, independent of raw technical capability.
Ecosystem and Tooling Integration
BigQuery sits natively inside Google Cloud, with tight integration:
- Cloud Storage
- Dataflow
- Pub/Sub
- BigQuery ML
- Connects easily to BI tools like Looker and Tableau
If your stack runs on dbt, BigQuery’s model-level compute behavior matters a lot for how efficiently those transformations run.
In comparison, Elasticsearch:
- Anchors the Elastic Stack
- Pairs with Kibana for visualization
- Logstash and Beats for ingestion
- Large plugin ecosystem for security and observability use cases
If your team is already standardized on ELK for logging, extending that stack usually costs less friction than introducing a second system.
Which to Pick: Elasticsearch or BigQuery?
You understand the differences between Elasticsearch and BigQuery, where each excels and falls short. Now let’s look at the specific use cases where each tool is strongest.
Choose BigQuery If
BigQuery is the best option for your team if:
- You’re running BI reporting, or analytical workloads over structured, large-scale data
- SQL is your team’s primary query language, and you want minimal infrastructure management
- You need to query years of historical data without managing retention manually
- You’re feeding data into ML pipelines or BigQuery ML models
- Predictable, serverless scaling matters more than sub-second lookups
Choose Elasticsearch If
In comparison, Elasticsearch is the better option if:
- You need full-text search as a core product feature, not just an internal tool
- Sub-second query response on operational data (logs, events, security data) is a hard requirement
- You’re building real-time monitoring, alerting, or SIEM workloads
- Your team already runs the Elastic Stack and the operational overhead is manageable
- Document-level flexibility matters more than strict schema enforcement
If you’re still unsure of which is best, the workload usually tells you. Ask if the value is in finding one thing fast, or aggregating everything accurately. That answer points you to the right platform faster than any feature checklist will.
Choose Both If
This doesn’t have to be an either-or decision. In practice, a lot of mature data teams run both Elasticsearch and BigQuery.
- Elasticsearch handles the operational layer, real-time search, log tailing, live dashboards, and anything where sub-second response time actually matters
- BigQuery serves the long-term analytical store for historical reporting, trend analysis, and BI, where scanning years of data with SQL is the point
Rather than treating this as duplicated infrastructure, treat it as separating concerns: real-time retrieval and long-horizon analytics rarely need to live in the same system, and the workloads that suffer most are usually the ones forced to do both.
Already on BigQuery? Make Sure You’re Not Overpaying for the Choice
If BigQuery is the right call for your analytics workload, the next problem isn’t which price to pick; it’s making sure you’re actually getting the pricing model right on an ongoing basis. Most teams default to on-demand billing and never revisit it or commit to reservations that sit partially idle outside peak hours. Either way, that’s compute spends leaking out with no one watching closely.
Yuki routes every BigQuery job to the most cost-efficient compute option in real time, on demand or reservation, based on what each query actually needs, without touching your queries, your pipelines, or your dbt models.
Most teams see 30% to 50% lower BigQuery compute costs within the first month, with no code changes and no manual tuning required. Request a free BigQuery cost analysis to see exactly where your current spend is going before you commit to your next reservation.