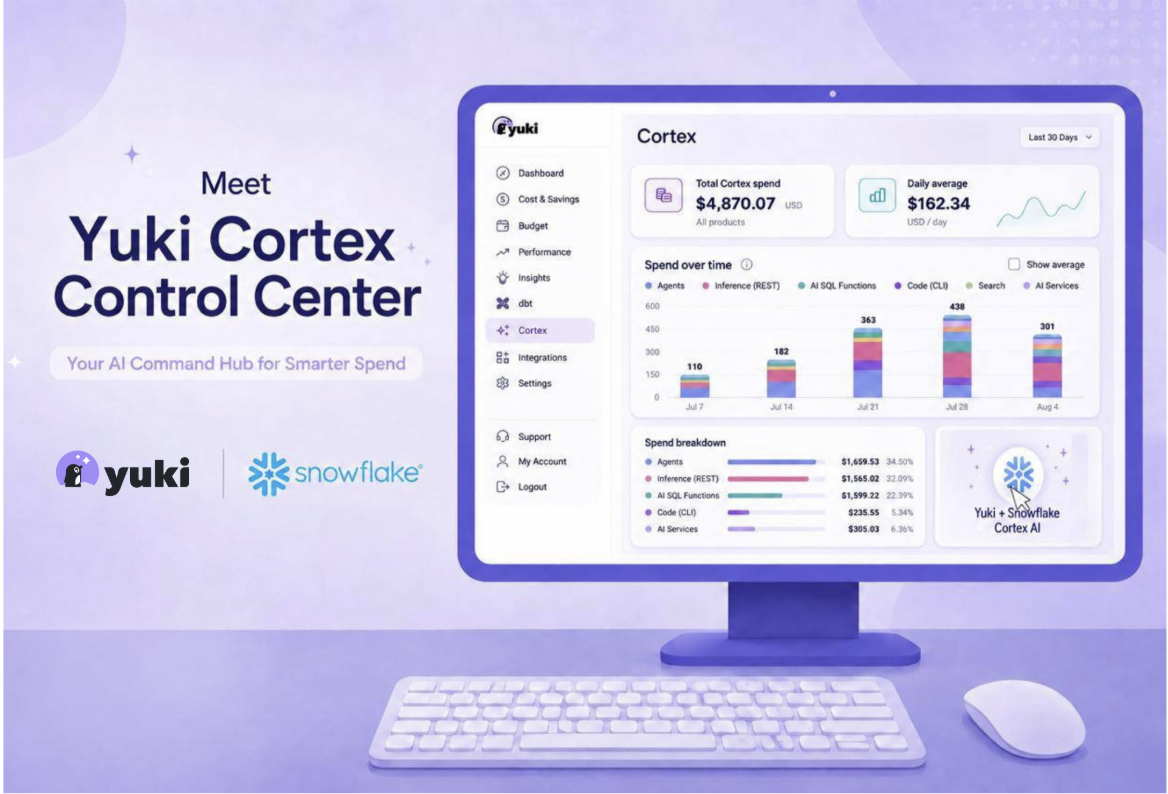
Snowflake Cortex makes it easier to build AI into your data stack. It also creates a new cost problem most teams are not ready for.
Agents, direct model inference, SQL functions, Cortex Search, and coding tools can all draw from the same credit pool. Usage spreads across models, applications, users, roles, and business teams. Then the bill goes up and everyone asks the same question:
What exactly are we paying for?
Most teams do not have a clean answer.
They can see total Cortex consumption. They may be able to pull usage data. But connecting spend to the agent, model, user, or workload responsible still takes manual investigation.
That is the problem the Yuki Cortex Control Center is built to solve. Try it now
It gives data, AI, engineering, and FinOps teams one place to understand Cortex spend, trace consumption to its source, and evaluate model performance alongside cost.
Cortex spend is becoming a black box
Traditional Snowflake cost management is already difficult.
AI adds another layer. Try it now
A single user action can trigger multiple model calls. An agent can run follow-up requests, retries, tool calls, and background workflows without direct human involvement. A new AI feature can move from a controlled test to heavy production usage faster than anyone expected.
The result is a bill that grows for several possible reasons:
- More users are adopting an AI product
- One agent is making too many calls
- A team switched to a more expensive model
- Prompts or responses are consuming more tokens
- Compute-heavy requests are increasing
- A specific role or business unit is driving usage
- Tail latency is rising even as spend increases
Those are very different problems.
They require different decisions.
But when every Cortex product is billed from one pool, the top-line credit number does not tell you what changed.
It only tells you that something did.
That is why Cortex cost management cannot stop at reporting total spend. Teams need to understand the workload behind the number.
One control center for Cortex cost and performance
The Yuki Cortex Control Center brings the most important Cortex signals into one operational view.
It helps teams answer four questions:
- How much are we spending?
- What is driving that spend?
- Which models and workloads are responsible?
- Are we getting the performance we expect for the cost?
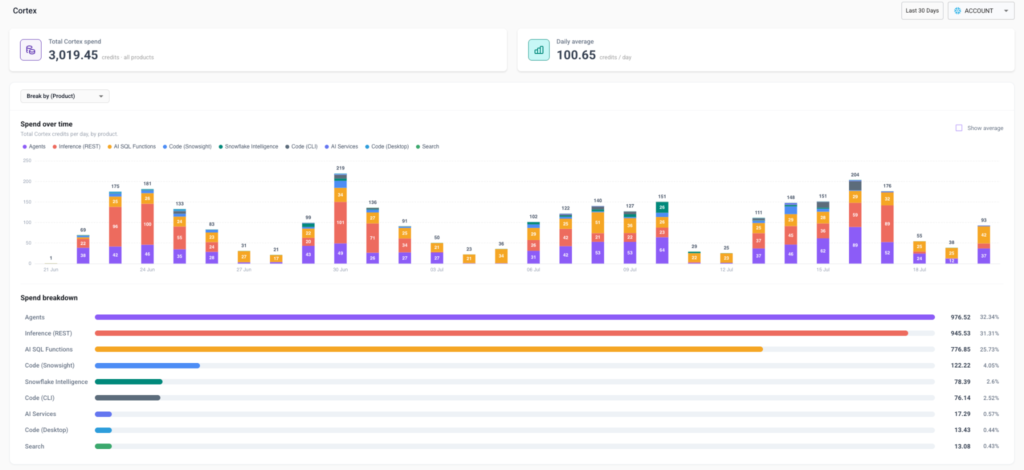
At the top of the Control Center, teams can immediately see:
- Total Cortex Spend: Total credits consumed across Cortex products during the selected period
- Daily Average: Average credits consumed per day
A date selector makes it easy to investigate a specific incident, compare different periods, or understand whether a spike was temporary or the beginning of a new cost baseline.
This gives teams the first layer of visibility.
The real value comes from moving beyond the total.
Break Cortex spend down by what actually matters
Cortex usage does not come from one source.
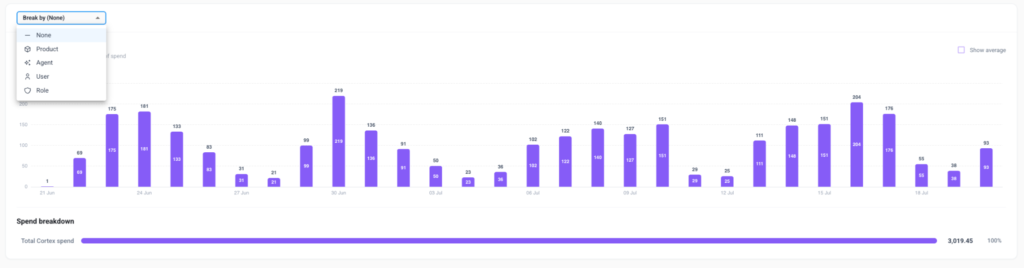
The Yuki Cortex Control Center lets teams examine spend over time and change the breakdown based on the question they are trying to answer.
Usage can be viewed by:
- Product
- Agent
- User
- Role
Each view adds a different layer of context. Try it now
Product-level visibility
Start by understanding which Cortex capabilities are consuming the most credits.
Spend may be coming from direct inference, agents, Cortex Search, SQL functions, coding tools, or another Cortex product.
Without that breakdown, the conversation stays vague: Cortex costs increased this month.
With product-level visibility, the conversation becomes actionable: Agent workloads drove most of the increase, while direct inference remained stable.
That distinction changes what the team does next. You do not need to restrict every Cortex workload. You need to investigate the product actually responsible for the growth.
Agent-level visibility
Agents change the economics of AI infrastructure.
A person typically initiates one request at a time. An agent may generate an entire chain of activity from a single action.
It can:
- Call a model
- Evaluate the output
- Query another system
- Retry a failed step
- Generate a follow-up request
- Continue until the task is complete
The user sees one interaction. Snowflake may process many.
The agent view helps teams identify which autonomous workloads are driving consumption. This becomes increasingly important as agents move from experiments into customer-facing or business-critical applications.
A growing agent workload may indicate successful adoption.
It may also indicate a loop, an inefficient workflow, excessive retries, or a poor model choice.
You need the source-level context before you can tell the difference. Try it now
User-level visibility
Not all AI adoption is equal.
One team may be using Cortex to power a high-value customer feature. Another user may be running repeated experiments with little oversight. A service account may suddenly begin generating far more traffic than expected.
User-level visibility helps teams understand who is behind the consumption.
This does not mean high usage is automatically a problem.
The goal is not to reduce every credit.
The goal is to know whether spend is intentional, valuable, and aligned with the business.
When teams can connect usage to users, they can have a much better conversation about adoption, accountability, and ROI.
Role-level visibility
For larger Snowflake environments, user-level reporting is not always enough.
Consumption often needs to be understood by function, team, business unit, or workload category. Snowflake roles can provide that organizational context.
The role view helps platform and FinOps teams identify where Cortex spend is accumulating across the business.
That supports better:
- Internal accountability
- Budget ownership
- Forecasting
- Chargeback discussions
- Access policies
- Executive reporting
Instead of one AI cost number owned by nobody, teams can connect usage to the part of the business creating it. Try it now
Spot cost spikes before they become normal
A sudden spike is easy to notice.
A slow, steady increase is more dangerous.
AI spend can rise gradually as teams add users, agents, models, and production workflows. By the time the increase appears in a monthly review, the higher cost may already feel normal.
The Spend Over Time view in the Yuki Cortex Control Center shows daily Cortex consumption as a stacked bar chart.
A 30-day average line gives each day immediate context.
That makes it easier to see:
- One-time incidents
- Sustained growth
- New usage patterns
- Unexpected changes
- Products moving above their normal baseline
When spend moves above the average, teams can change the breakdown to Agent, User, Role, or Product and begin tracing the increase.
The aggregated view below the chart also shows total credits and percentage share by product for the selected period.
This matters because the workload responsible for today’s spike may not be the workload consuming the largest share of the monthly budget.
The Control Center helps answer both questions:
What changed today?
And:
What is costing us the most over time?
Understand the true cost of every model
A model’s total credit consumption is only part of the story.
Two models can generate the same total spend for very different reasons.
One may be processing large prompts and responses, creating high token consumption.
Another may be using more compute per request.
A third may simply be receiving a much larger number of calls.
The Yuki Cortex Control Center provides a model-level view that includes:
- Query volume
- Token credits
- Compute credits
- Token and compute credit split
- Total credits
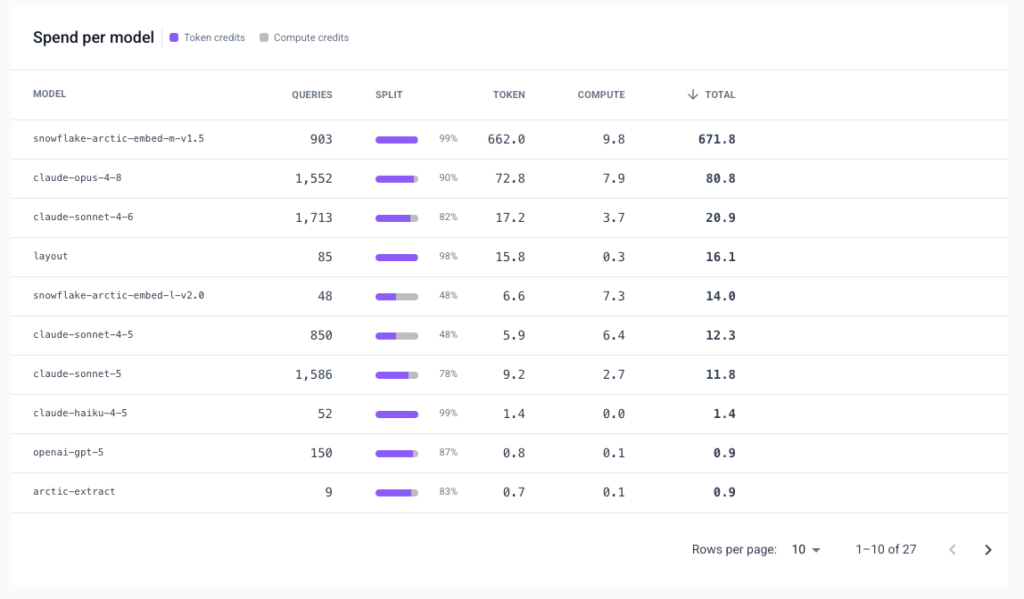
This lets teams move from broad cost reporting to real model economics.
For example, suppose Model A and Model B each consume 100 credits.
At first glance, they look equally expensive.
But Model A may have processed four times as many requests. Model B may have a much higher compute cost per call. One may be efficient at scale, while the other may be expensive even at low volume.
Without the split, those differences stay hidden.
With the split, teams can make better decisions about:
- Model selection
- Routing logic
- Prompt design
- Use-case fit
- Production standards
- Cost-performance tradeoffs
This is especially important when different teams choose models independently.
The most advanced model is not automatically the right model for every task.
In many cases, the right question is not:
Which model is best?
It is:
Which model delivers the right result, at the right speed, for the right cost?
Compare cost and latency in the same conversation
AI cost optimization often fails because teams look at cost and performance separately.
FinOps sees credit consumption.
Engineering sees latency.
Product sees user experience.
Leadership sees the total bill.
Everyone has part of the picture, but nobody has the full context.
The Yuki Cortex Control Center helps close that gap with model and function latency views at three percentiles:
- P50: Typical response latency
- P95: Slower responses that affect a meaningful share of requests
- P99: Tail latency representing the slowest user experiences
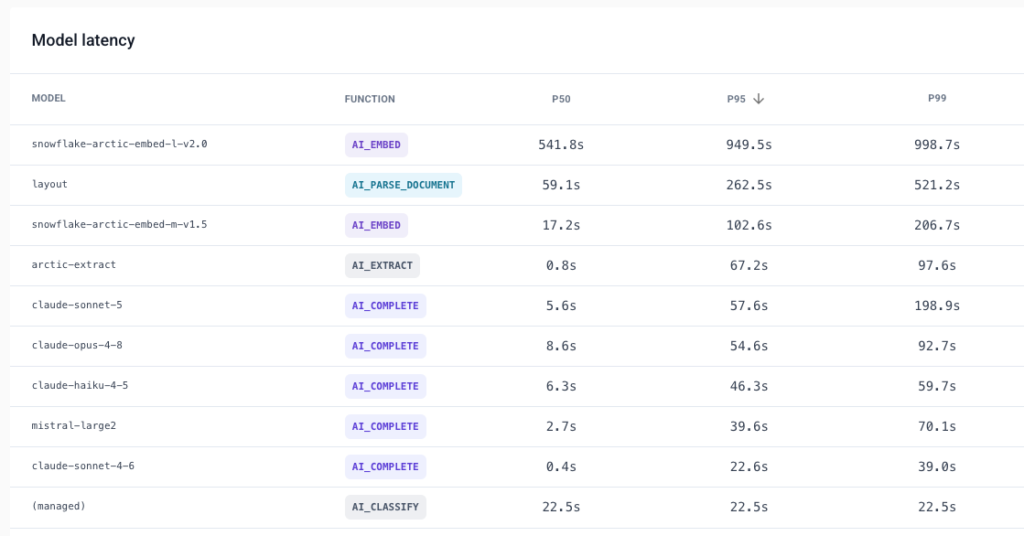
This is critical because averages hide the worst moments.
A model may appear fast overall while still producing long delays for a smaller but important group of users.
A customer-facing AI feature with a healthy P50 and a poor P99 can still feel unreliable.
A higher-cost model may not deliver better latency.
A specific function may be creating most of the performance problem.
By sorting and comparing latency percentiles, teams can identify the experiences that a simple average would miss.
Now cost decisions do not have to be made in isolation.
Teams can evaluate whether higher spend is delivering:
- Faster typical responses
- Better tail latency
- More consistent performance
- Higher workload volume
- No meaningful improvement at all
That is a much stronger foundation for model governance.
From “Cortex got expensive” to a real answer
Consider a common scenario.
Your daily Cortex spend increases by 40 percent.
Without the Yuki Cortex Control Center, the investigation may involve:
- Pulling usage data manually
- Writing custom SQL
- Comparing billing periods
- Messaging multiple engineering teams
- Checking service accounts
- Reviewing model configurations
- Looking through application logs
- Guessing which deployment caused the change
That can take hours or days.
And even after the work, the team may still have an incomplete answer.
With the Control Center, the investigation becomes much more direct:
- Open Spend Over Time.
- Identify when consumption moved above the 30-day average.
- Break the increase down by Product.
- Switch to Agent to identify the workload responsible.
- Review the users or roles associated with the activity.
- Compare query volume across models.
- Check the token and compute credit split.
- Review P50, P95, and P99 latency.
- Determine whether the higher spend is producing better performance or simply more cost.
The team can now tell whether the increase came from:
- Successful adoption
- Higher request volume
- Excessive agent activity
- A more expensive model
- Prompt or response growth
- Compute-heavy workloads
- Poor performance despite higher spend
That is the difference between visibility and control.
Built for every team responsible for production AI
Cortex spend is not just a FinOps issue.
It touches every team involved in building, running, and funding AI products.
Data and AI teams
See which models, functions, and agents are driving usage.
Use real production data to improve model selection, application behavior, and prompt design.
Instead of optimizing based on assumptions, teams can see how workloads actually behave.
Platform engineering
Investigate cost and performance changes without manually reconstructing activity across Snowflake.
Identify the workloads creating pressure before they become larger reliability or budget problems.
The Control Center reduces the operational burden of answering one-off cost questions from every team.
FinOps
Move beyond a single Cortex line item.
Break consumption down by product, agent, user, role, and model. Improve forecasting and make budget conversations more specific.
The value is not another dashboard.
It is a clearer connection between consumption and accountability.
Engineering leadership
Understand whether Cortex investment is translating into productive adoption.
See which teams and products are using AI, where costs are increasing, and whether performance is improving with spend.
That makes it easier to fund the right workloads and challenge the wrong ones.
Product leaders
Connect AI infrastructure behavior to the products customers actually use.
A cost increase may be justified when adoption and customer value are growing.
It may not be justified when spend rises without better performance or meaningful usage.
The Control Center gives product teams the context to know which situation they are in.
The first guardrail for agentic AI is visibility
Enterprises do not need fewer AI experiments.
They need better control over the experiments that become production systems.
That starts with visibility. Try it now
Before a team can optimize Cortex spend, it needs to know:
- Which product is consuming credits
- Which agent is generating activity
- Which user or role is behind it
- Which model is being called
- Whether cost comes from tokens or compute
- How much request volume is increasing
- Whether latency is improving or getting worse
The Yuki Cortex Control Center brings those signals together.
This becomes more important as autonomous workloads grow.
Agents can create infrastructure demand faster than manual reporting processes can keep up. Monthly reviews are not enough. Aggregate totals are not enough. Custom investigations for every cost spike are not scalable.
Teams need an operational view of Cortex usage.
Not after the bill arrives.
While the workload is running.
AI cost control should not mean slowing down AI
Most organizations respond to unpredictable infrastructure spend in one of two ways.
They overcorrect and restrict usage.
Or they let teams move fast and hope the bill stays manageable.
Both approaches create problems.
Restricting access too early can slow innovation and force teams back into approval-heavy processes.
Ignoring cost can turn successful adoption into an unexpected budget problem.
The better approach is to give teams enough visibility to move quickly with guardrails.
The Yuki Cortex Control Center is designed to support that model.
Teams can experiment.
Developers can build.
Business units can adopt new AI workflows.
Leadership can still understand where credits are going and whether the investment is delivering value.
Control should not mean blocking usage.
It should mean making informed decisions before cost becomes a surprise.
One place to understand Cortex spend
Snowflake Cortex gives teams the building blocks to create AI applications inside their data platform.
The Yuki Cortex Control Center gives them the operational context to run those applications responsibly.
With the Control Center, teams can:
- Track total Cortex spend and daily average consumption
- Monitor usage trends over time
- Compare spend with a 30-day baseline
- Break usage down by product, agent, user, and role
- Analyze query volume by model
- Separate token credits from compute credits
- Compare model cost and performance
- Investigate P50, P95, and P99 latency
- Trace cost spikes back to the workloads driving them
- Build clearer accountability around enterprise AI usage
Ready to see what is driving your Cortex spend?
Yuki is opening the Cortex Control Center to Snowflake teams that want deeper visibility into AI cost and performance.
See which products, agents, models, users, and roles are consuming your Cortex credits, then understand whether that spend is delivering the performance your workloads need.
Request a walkthrough of the Yuki Cortex Control Center. Try it now